Low-cost computing, better algorithms enable higher accuracy
MARK RODIGHIERO
Manufacturers of mission-critical items such as medical devices, sensors and electronics used in aerospace applications, battery interconnections, and automotive safety devices have a pressing need for cost-effective means to improve confidence in the quality of the laser spot welding processes used in production. Certain welding quality defects can be caused by inconsistencies in the laser welding setup, such as gap between weldment materials, improper focus, or lack of cover gas.
A laser process monitor can detect these kinds of setup problems, but often with mixed results. However, the confluence of low-cost, high-performance computing power and the recent proliferation of remarkable data science techniques, combined with time-honored statistical methods, makes possible a new way of using sensor data from the monitors to improve their ability to detect these problems, helping manufacturers attain higher product-quality goals at lower costs.
Commercially available laser process monitors use one or more sensors, such as photodetectors or cameras to measure the optical power of the light emitted from the weld site as a consequence of the laser (spot) weld event. These sensors generate considerable amounts of high-bandwidth time-series data from each laser pulse, but these monitors typically aggregate the data to just a few statistics such as average, minimum, and maximum values, or compare the signal to predefined upper and lower limits. This means that most of the collected sensor data is thrown away—data that could reveal insights into the laser spot weld process. While one way to improve the success of laser spot weld monitoring might be to add additional sensors with corresponding additional costs, another approach is to make much better use of all the data generated by the sensors in the first place.
Extracting data features from the waveform
In this example, strips of stainless steel sheet metal were laser spot-welded under various setup conditions of part-to-part gap, focus, and presence of cover gas. An AMADA MIYACHI MM-L300A laser process monitor with an optical sensor measures emissions from the laser spot weld site. Out-of-the-box data analysis capability of this instrument is typical of laser process monitors in that it can calculate the average, maximum, and minimum values of the sensor signal over a predefined interval, and can compare the instantaneous value of the signal to pre-defined upper and lower limits.
More importantly, the instrument also captures and stores complete sensor waveform data for each weld—data that can be subjected to further analysis. This waveform data is a rich source of information and can be used to generate many additional data features for weld quality assessment. These additional new features improve the ability to model the laser spot weld process and to train a machine learner to predict gap, focus position, and cover gas status.
Description of setup
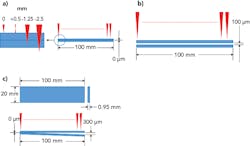
The three sets of samples used in this experiment are illustrated in FIGURE 1. For the gap prediction experiment, two pieces of 304 stainless steel sheet metal were arranged with linearly varying gap from 0 to 300 µm (FIGURE 1a). Ninety-four pulsed fiber laser welds with constant peak power and pulse width were performed with the laser focused on the surface. Trials with and without nitrogen cover gas were performed, and an additional set of trials (28 welds) with a fixed 100 µm gap between the parts were run with and without cover gas (FIGURE 1b). Finally, focus tests comprised of a total of 54 weld trials on the same materials with laser focus set at four positions included at the surface, +0.5 mm above the surface, and -1.25 and -2.5 mm below the surface (FIGURE 1c).
FIGURE 1. Test sample configurations are shown for a 0–300 µm gap prediction experiment, with and without cover gas (a); a gas/no gas prediction with a fixed 100 µm gap (b); and a focus position experiment (c).
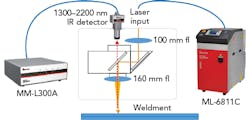
The laser used for all trials was an AMADA MIYACHI ML-6811C single-mode fiber laser, programmed for 400 W peak power, 5.0 ms pulse width. The laser energy was delivered through a focus head with a 100 mm focal length re-collimator lens and a 160 mm focal length output lens. The optical sensor for the MM-L300A laser process monitor was mounted in the camera view port on the focus head (FIGURE 2).
FIGURE 2. The optical sensor for the MM-L300A laser process monitor was mounted in the camera view port on the focus head.
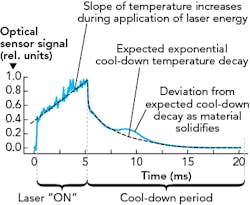
The MM-L300A laser process monitor produces one data record per weld event. The data record includes complete waveform time-series data, as well as its average, maximum, and minimum values. FIGURE 3 shows a typical waveform. The operator added “labels” such as gap dimension, focus position, and cover gas status to each record to identify the conditions under which each weld was performed.
FIGURE 3. An example of a typical waveform sensor shows cooling rate details characteristic of laser spot welding.
Data-driven feature generation
The waveform data was then used to generate additional features that were subsequently added to each data record. An algorithm identified “interesting” sections of the waveform data, extracted data features from each of these sections, and identified which features are important for modeling or prediction tasks. The final features were then used to model the laser spot welding process under various conditions, or to train a machine learning algorithm to estimate the conditions under which a new, unseen weld was performed. To be practical for production use, all feature generation tasks are fully automated, requiring little operator interaction for setup.
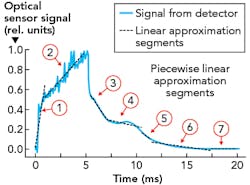
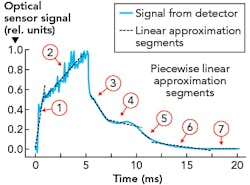
FIGURE 4. Automatically segmented sensor data, where optimized piecewise linear segments are shown (numbered); de-trended segments are plotted in the lower section of the graph.
FIGURE 4 shows the results of the segmentation process, where the number of segments can be set by the operator. Automatically optimized start and stop times are determined by the segmentation process for each segment. A proprietary algorithm extracts 108 data features from each segment, yielding (from seven segments) 756 features plus the waveform average, maximum, and minimum values available from the MM-L300A laser process monitor for a total of 759 data features. Finally, the algorithm determines that, in this case, 80 features contribute significantly to the modeling or prediction tasks.
Results
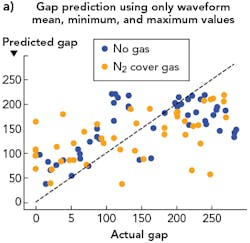
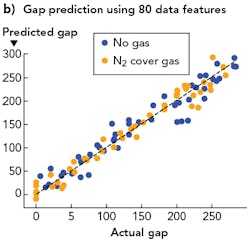
Improvement in predicting gap distance by using the additional data features is striking. FIGURE 5a shows predicted vs. actual gap measurements using the basic statistics available from the MM-L300A laser process monitor, while FIGURE 5b shows a marked improvement in prediction when all 80 significant features are included.
FIGURE 5. Gap prediction results using the three standard data features provided by the MM-L300A (a) and when all 80 significant data features are included in the machine learning training task (b) are shown.
In practice, it is possible for multiple laser setup defects to occur at the same time, and it is desired to be able to identify each. For example, it might be the case that cover gas is not present and at the same time, there is a gap between the pieces being welded. FIGURE 6a shows that perfect prediction for gas presence detection is possible—even with just one feature (waveform average)—for the samples with constant 100 µm gap between the stainless steel plates. However, the accuracy drops to 75% when the data also includes samples with gap varying from 0 to 300 µm (FIGURE 6b). Including more features in the analysis raises the gas detection accuracy to 100% (FIGURE 6c).
FIGURE 6. Perfect classification of gas presence or absence on the sample with fixed 100 µm gap (a); correct detection of presence of cover gas drops to 75% when the data also includes gap that varies 0–300 µm between materials (b); and perfect classification gas presence prediction accuracy for the case of varying gap when the new data features are included in the analysis (c) are shown.
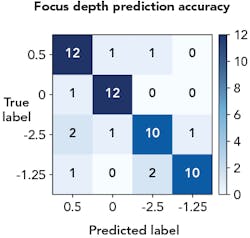
For the focus experiment, several weld trials were performed at each of four focus positions. The task here is to predict which of the four focus positions was the most likely case for each weld trial. A standard machine learning algorithm was evaluated using cross-validation, producing classification accuracy of 83% with 0.03% standard deviation. FIGURE 7 shows the results for all test case predictions.
FIGURE 7. Predicted vs. actual focus positions are shown; classification performance on test data was not used in the algorithm training process.
Traditional process monitors collect data from one or more sensors, and then reduce the data to a few aggregated statistics. However, the proliferation of low-cost computing power along with modern machine learning algorithms and evaluation techniques make possible a much better use of the data available from laser process monitor sensors. These tools can lead to much greater accuracy in modeling the laser spot weld process and in predicting the occurrence of production defects that can contribute to unacceptable spot weld quality.
MARK RODIGHIERO ([email protected]) is executive vice president of technology and business development at AMADA MIYACHI AMERICA, Monrovia, CA; www.amadamiyachi.com.
