ByHoward M. Shapiro
Recent advances in optics and electronics could make cytometric technology highly affordable and broadly applicable within the next few years, filling new niches and challenging the traditional dominance of flow cytometry in some older ones. Ultimately, systems could be built, run, and maintained where they are needed—by the people who need them—for such applications as malaria diagnosis.
Cytometry, now broadly defined to include counting, classification, and characterization of biological cells and similarly sized objects, began when cells were first discovered in the late 1600s. Until the late 1940s, cytometry depended upon human observers using microscopes. From then on, increasingly sophisticated instruments known as cytometers have replaced microscopy wherever budget and infrastructure allow (see sidebar, "The origins of cytometry").
Apparatus, reagents, and other tools for cytometry now represent a multibillion-dollar market. Although the sophistication and cost of high-end instruments continue to increase, advances in optics and electronics during the past two decades could make cytometric technology affordable and applicable for a broader range of tasks worldwide within the next few years. Modest imaging devices can now make the same types of measurements as flow cytometers, and may fill many new niches and challenge flow cytometers' dominance in some older ones.
The new cytometric paradigm
The sophistication of cytometric identification of cell types accelerated from the mid-1970s on, in large part because immunophenotyping with monoclonal antibodies, the development of which was greatly facilitated by flow cytometry, provided previously unattainable specificity. Additional reagents that recognized specific nucleic acid sequences were also added to the cytometric armamentarium. The availability of more and better reagents increased demand for more measurement parameters at precisely the same time it became cost-effective to incorporate personal computers, which by that time were powerful enough to manage data acquisition and analysis, into flow cytometers.
Typical flow cytometers do not make high-resolution images of cells, although additional measurements of light scattering may provide indications of cell size and/or cytoplasmic granularity. Some cell identifications can be done with relatively low-specificity reagents; e.g., DNA-, RNA-, and protein-binding dyes, and/or scattering measurements. For others, including many in microbiology, sequence-specific nucleic acid probes and/or fluorogenic enzyme substrates, which produce fluorescent products in cells containing various specific enzymes, may be required. Physiologic characteristics such as membrane integrity and potential, pH, and various aspects of oxidative metabolism can be quantified, and introduction of fluorescent proteins into cells has provided an entirely new approach to examination of biological phenomena.
Limitations and alternatives
I have often described a cytometer as a box into which one puts cells and out of which one gets numbers. If the numbers are right, the user shouldn't care what's in the box—what the user should care about is how little it can be made to cost and how easy and reliable it is to use.
In microscopy and high-resolution imaging cytometry, where detail at the subcellular level is necessary, very small areas of the sample must be moved into view and/or focus and dozens or hundreds of pixel values must be measured to characterize a single cell. The apparatus must contain hardware and software (some of each provided by a human in the case of microscopy) capable of moving specimens in sub-micrometer increments in three dimensions to allow cells of interest to be brought, one at a time, into the field of view and to obtain properly focused cell images.
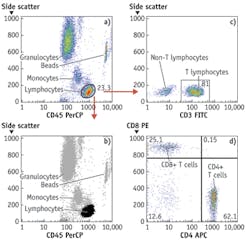
Most optical flow cytometers get the numbers by sequentially measuring small amounts of light coming from small regions of space ideally containing single cells or particles; each datum presents an optical signature of the whole cell or particle in the relevant spectral region, from which there is no possibility of retrieving information about cellular detail. A relatively simple and inexpensive fluidic system transports cells in single file through one or more measurement stations, each equipped with a light source, illumination and collection optics, and one or more photodetectors. Measuring thousands of cells per second requires that intense light sources, usually lasers, costing between several hundred dollars and tens of thousands of dollars each, be used for fluorescence excitation and that a sensitive detector, usually a photomultiplier tube (PMT) and associated electronics with a total cost of around $1,000, be used for each wavelength region of interest (see Fig. 1).
By the late 1980s, it was shown that equivalent measurements could be made of cells immobilized on a static substrate by scanning a laser beam over the specimen; using a smaller laser focal spot size than is typical in a flow cytometer can provide multipixel images of the cells. A laser scanning cytometer, which is slower than a flow cytometer, must, however, incorporate both the laser(s) and PMTs of a flow cytometer and the motion control capabilities of an automated microscope, making it more costly and complex than either.
Taking the flow out of flow cytometry
In the early 1990s, it was demonstrated that digital cameras could simultaneously capture and isolate low-level, low-resolution light signals from many cells dispersed over a large area. Such widefield imaging could use a considerably simpler instrument configuration to provide information of the same quality as could be obtained from flow cytometers. It did not, however, initially offer any substantial reduction in cost. Although motion control components might be dispensed with, the arc lamp or laser light source required for fluorescence excitation still costs thousands of dollars, and a digital camera might then cost even more.
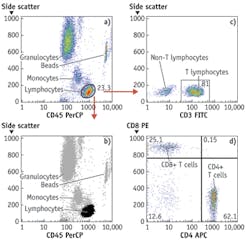
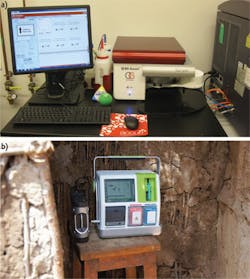
By around 2003, light-emitting diodes (LEDs), which have since made their mark in many general lighting applications, had become sufficiently powerful to be usable for excitation of fluorescence of nucleic acid and protein dyes in cells and could be bought for less than $100, and prices of digital cameras were approaching that point. These components could therefore be built into inexpensive widefield imaging cytometers capable of detecting small numbers of TB bacilli or malaria parasites in sputum or blood smears and a broad range of other analyses on cells and bacteria in suspension or on substrates. At present, LEDs costing no more than tens of dollars can provide sufficient light over a 10 × 10 mm area for a similarly priced CMOS camera chip to detect a few thousand molecules of fluorescent antibody on cells or beads with no more than a few seconds' exposure. Imaging cytometers are now commercially available for various tasks, including CD4 T-lymphocyte counting for monitoring HIV/AIDS treatment and multiplexed bead immunologic and molecular biological assays (see Fig. 2).
Although flow cytometers do not produce clear images of the cells passing through them, high precision (coefficients of variation [CVs] of 1–2%) can be attained in fluorescence measurements. My colleagues and I have matched the 3–5% CVs levels typically available in clinical flow cytometers in small ("toaster-sized") low-magnification, low-resolution widefield imaging cytometers. The camera chips we use are only slightly higher-priced than the camera chips used in smartphones, differing, critically, in their substantially larger pixel size and chip area. The larger pixels can store more electrons than the much smaller pixels in a typical smartphone camera; this is necessary to maintain an adequate dynamic range for cytometric measurements. The larger chips make it possible to collect data from fields of view larger than 10 × 10 mm in a single exposure, allowing examination of several microliters of blood, sputum, or other material in a smear or counting chamber. Even if multiple LEDs, several cameras, and associated dichroics and optical filters are used to maximize fluorescence sensitivity, permitting detection of fewer than 2,000 molecules of label, a multiparameter widefield imaging apparatus can be assembled for no more than a few thousand dollars. One basic optical configuration can be used to examine specimens on slides (suspensions or smears), in chambers, or in multiwell plates.
The measurements of light scattered at small angles to the illuminating beam ("forward scatter") made in most flow cytometers do not, as is widely believed, provide reliable indications of cell size, and none of the standard optical measurements made in flow cytometers, singly or in combination, however, yield(s) values proportional to Coulter volume.2 We have revived an optical method for true cell volume measurement based on dye exclusion on which patents are now expired. The dye used must neither adhere strongly to or be taken up by the cells; these are desirable characteristics for food colorings, many of which can be used for the measurement and almost all of which cost very little.
"Side scatter" measured at 15° to 135° angles from the illuminating beam in flow cytometers is generally described as providing an indication of cells' "granularity" or "complexity." We and others have noted that such measurements are highly correlated with measurements of the fluorescence of protein dyes; the correlation holds in a variety of cell types, including bacteria, and it has also been reported that fluorescence from cells stained with a protein dye tracks "dry mass" measurements of cells made by interference microscopy, also known to be primarily representative of total protein content. In flow cytometry, in which side scatter costs less to measure than does fluorescence, it makes sense to estimate protein content from the scatter measurement. In widefield imaging, it is generally easier to use a fluorescent protein dye to acquire that information.
Birefringent materials, including cytoplasmic granules of eosinophil white blood cells (WBCs), the "malaria pigment" hemozoin in parasitized red blood cells (RBCs), and various colloidal metal labels for antibodies or other ligands, can readily be detected by both microscopy and widefield imaging using polarized light. The optical signals involved are generally of high intensity. Polarization measurement capacity is not incorporated in most flow cytometers; although it can be added simply and inexpensively to older and some newer models, this cannot be done as easily on the many newer instruments that use polarization-scrambling fiber optics in their light collection paths.
Widefield imaging and the future
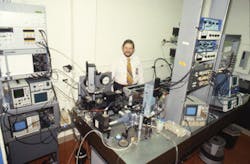
In 1969, before I began working with flow cytometers, my colleagues at NIH and I built what was probably the first computerized microscope, at a cost of several hundred thousand dollars.3 In 1999, I spent less than $100 to buy my grandchildren a digital microscope "toy" developed jointly by Intel and Mattel and run from a personal computer's USB port; it had nearly equivalent imaging capability, although it lacked a high-precision motorized stage. I thought then that a 1½ log increase in price, to $3,000, could probably cover the cost of a reasonably useful and versatile cytometer, making an important technology available to many more people in many more places than is now the case.
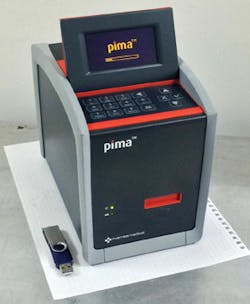
Widefield imaging systems can now make a broad range of measurements made in flow cytometers (see Fig. 3). They are not readily adaptable to the same kind of sorting, or to detection of fewer than 2,000 molecules of most antibody labels, or to measurement of more than six parameters, but they can do tests that occupy most flow cytometers more than half the time, including multiplexed ligand binding assays on optically encoded beads as well as measurements of eukaryotic cells and microorganisms. The least expensive flow cytometers now available cost over $10,000 and measure two or three parameters; a relatively sophisticated five-parameter widefield imaging cytometer with comparable sample throughput could probably be sold for half that price and utilize substantially less reagent (see Fig. 4). The imaging cytometer would also be far less complex, and therefore less likely to fail and easier to maintain.
Such an apparatus could clearly meet the needs of small organizations that do the same kinds of testing—e.g., clinical hematology and microbiology and food, water, cosmetic, and pharmaceutical analysis—as larger organizations are now using flow cytometers, but cannot afford or support the more expensive apparatus. Manufacturers of flow cytometers, laser scanners, and other more expensive cell analysis equipment have not had anything to sell to this substantial market because they have not been able to make a sufficiently cheap and simple apparatus.
The technology is entirely in the public domain—it is essential to include as few components as possible and to avoid paying extra money for unnecessarily high performance. The personal computers first incorporated into flow cytometers in the 1980s outperformed 1960s mainframes, and were beginning to put the minicomputer companies out of business. Today's smartphone processors are now even faster and have many times the storage capacity, and devices using those processors are eroding the personal computer market. A competitive image cytometer design will have to integrate the smaller processors, Fortunately, open-source hardware and software for prototyping the instruments are now available.
These devices, although usable at points of care in resource-poor settings, should not be conceived as merely "good enough"; they implement state-of-the-art measurements utilizing technology that is advanced but not expensive. They can ultimately be built, run, and maintained where they are needed by the people who need them, with or without the aid of existing manufacturers. My colleagues and I are committed to helping this happen sooner rather than later, particularly with respect to improving malaria diagnosis and facilitating field work on that disease. We welcome help.
REFERENCES
1. L. Hallermann, R. Thom, and H. Gerhartz, Verh. Deutsch. Ges. Inn. Med., 70, 217–219 (1964).
2. A. Tzur, J. K. Moore, P. Jorgensen, H. M. Shapiro, and M. W. Kirschner, PLoS ONE, 6, 1, e16053 (2011).
3. P. G. Stein, L. E. Lipkin, and H. M. Shapiro, Science, 166, 328–333 (1969).
HOWARD M. SHAPIRO, MD, PC, is founder of The Center for Microbial Cytometry (Allston, MA) and author of Practical Flow Cytometry (4th Edition, John Wiley and Sons, 2003), which can be downloaded without charge at http://bit.ly/1cywGaZ. Contact him at [email protected].
The origins of cytometry
From the beginning, cells in single-cell suspensions have been easier to deal with than cells in multicellular organisms and tissues. Blood and other body fluids, pond and ocean water, and foods and beverages undergoing fermentation provide specimens, as do cultures. The discovery of microbial pathogens and of disorders such as anemias and leukemias, in which cellular changes in the blood could be correlated with clinical course, brought microscopy into clinical use in the mid-1800s. Calibrated chambers in which cells in suitably dilute suspensions could be counted at relatively low (100X) magnification came to be called "cytometers."
Instruments that detected and counted cells passing through a sensing zone in single file in a fluid stream began to be used in clinical labs to count red and white blood cells (RBCs and WBCs) around 1960, but were not called "flow cytometers" until the mid-1970s. They descend directly from an instrument built during World War II that used light scattering to detect potential biological warfare agents in aerosols. A filtered air sheath confined the sample stream to the dark field-illuminated center of the flow chamber; the light source was a Ford headlight. A photomultiplier tube (PMT) detected particles as small as 0.6 μm in diameter. By the early 1950s, instruments with similar optical configurations had been produced as blood counters, and Wallace Coulter had developed competitive technology that detected cells by the increase in electrical impedance they produced while traversing a small orifice. Impedance measurement capability, which provides a true indication of cell volume, a parameter not reliably obtainable by any optical flow cytometric technique, is still incorporated in some commercial flow cytometers.
The input sample for RBC counts is typically anticoagulated whole blood, diluted a few hundredfold to minimize coincidences; i.e., the arrival of two cells within too short an interval for the sensor to distinguish their signals. The signal from a scattering or impedance sensor does not by itself identify the object that generated it. Each microliter of blood contains millions of RBCs, thousands of WBCs, and hundreds of thousands of platelets. RBC volume is ~90 fL, WBC volume is normally ~200 to ~500 fL, and platelet volume is <20 fL. Setting a threshold, or trigger level, on the signal is generally sufficient to exclude platelets and other small particles present in blood from the count. Including WBCs in the RBC count has minimal effects on accuracy if the cell types are present in their normal ratio of ~1:1,000. Even a grossly elevated WBC count; e.g., 100,000/μL, would make the reported value only 2% higher if the true RBC count were 5,000,000/μL.
WBCs are counted after RBCs are lysed using a detergent or a natural product such as saponin. Failure to lyse even one RBC per thousand would yield a WBC count approximately twice the true value; lysis of some WBCs would produce counts below the true value. What was arguably the first multiparameter flow cytometric approach to this problem, suggested in 1964,1 used acridine orange to stain cell nuclei, and added measurement of green fluorescence to the light scattering measurement in a commercial blood cell counter. WBCs were thus distinguished from normal RBCs, although nucleated RBCs, not present in normal blood, would have been counted as WBCs. It was noted that a red fluorescence measurement could be used to distinguish granulocytes from monocytes and lymphocytes; the PMT available on the instrument did not, however, have sufficient red sensitivity to do this. Fluorescence flow cytometry did not see significant further use until several years later.
Although flow cytometry could provide RBC and WBC counts, with the above caveats, by 1960, identification of different WBC types (the differential count or "diff") and detection of microbial pathogens still required information about subcellular detail only available via high magnification (400–1000X) microscopy. Until the 1970s, attempts at automating blood cell identification therefore concentrated on analysis of cell images obtained by transmitted light microscopy of stained smears. Dye mixtures originally introduced by Paul Ehrlich around 1880 were refined by others, yielding stains such as Wright's and Giemsa's, both still in use. Ehrlich's methods also facilitated discoveries by Robert Koch of bacterial causes of anthrax and TB, and his "acid-fast" TB stain inspired Christian Gram's development of what remains the most widely used bacteriologic staining method.
The dyes in classical stains do not provide high specificity. Acid dyes such as eosin stain basic proteins, whereas basic dyes such as methylene blue stain nucleic acids (both RNA and DNA) and other acidic substances. Staining characteristics of different cell types reflect fairly gross differences in chemical composition, and the high dye concentrations used make quantitative measurements difficult. The size, shape, color, and "texture" of cells and their constituents, primary morphologic bases for cell identification since decades before the details of the chemistry and interactions of DNA, RNA, and various proteins became known, provide only indirect chemical information at best, and thus vary in reliability.
For example, although blood granulocytes can be readily identified by type, estimating their maturity by nuclear shape is more problematic. Small monocytes are routinely misidentified as lymphocytes, and morphology provides no reliable information that allows T and B lymphocytes or their subtypes to be discriminated by human or computer analysis of classically stained blood cell images. Although image analysis-based white cell differential counters reached clinical laboratories in the 1970s, almost all such instruments had been replaced by apparatus using one or another flow cytometric technique by the 1990s. Current attempts to resurrect old-fashioned WBC imaging for point-of-care (POC) applications, especially in resource-poor areas, are at best misguided. It is ironic, and perhaps tragic, that better, simpler image cytometers, with performance at least equal to that of modern flow cytometric hematology counters, could be made at the same cost as a retro POC apparatus.
The present dominance of flow cytometers for both clinical and research uses reflects lessons learned since the 1930s, when cell biologists first examined nucleic acid and protein content of individual cells. By the 1940s, one of Ehrlich's old dye combinations had been used for DNA and RNA quantification. Such measurements were subsequently shown to discriminate both normally growing cells and cells in tumors from quiescent differentiated cells and to be useful for detection and characterization of malaria parasites in blood; they can now be implemented easily in both flow and image cytometers using fluorescent dyes. Initial applications of the first commercial fluorescence flow cytometers in the late 1960s and early 1970s were largely directed at nucleic acid analysis of tumor cells; flow cytometric differential WBC counters typically based cell identifications on histochemical stains and light scattering properties, for the most part avoiding use of fluorescence.
